2 Gallery
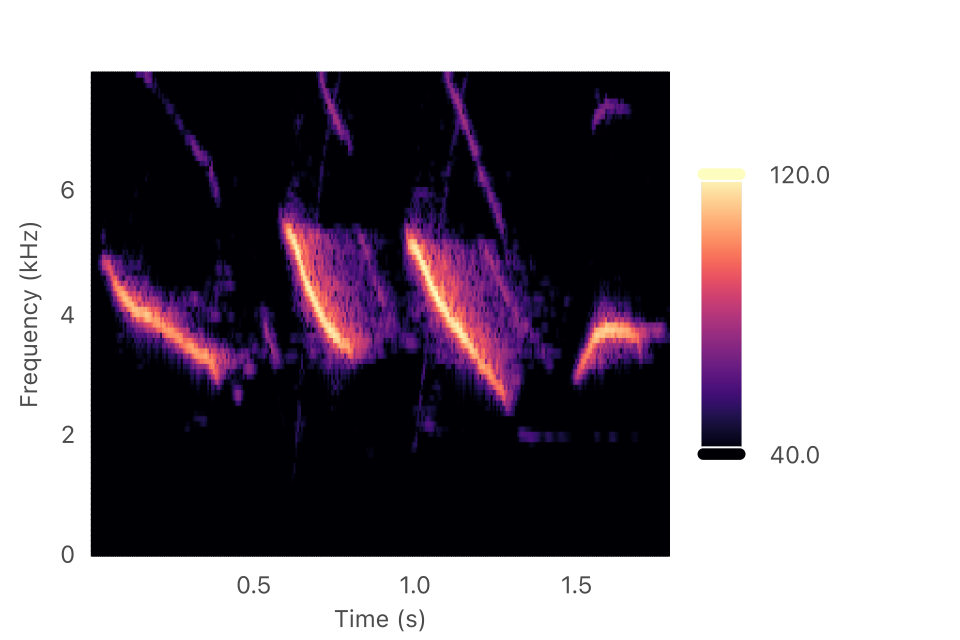
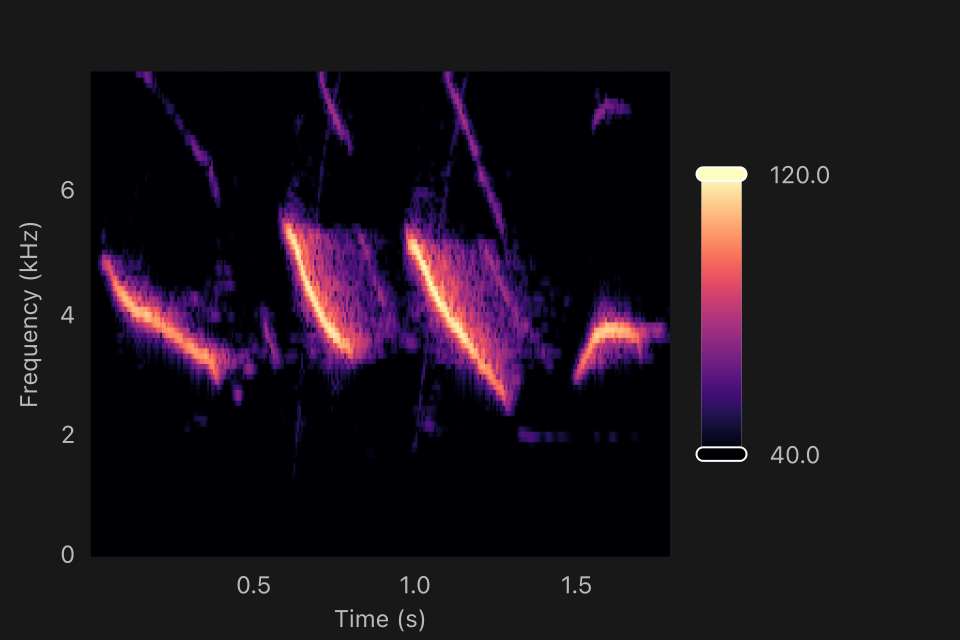
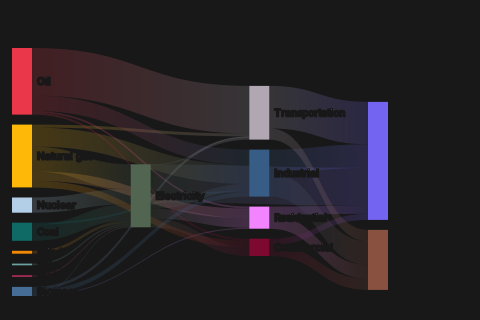
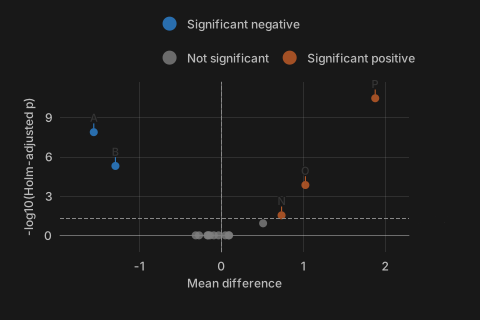
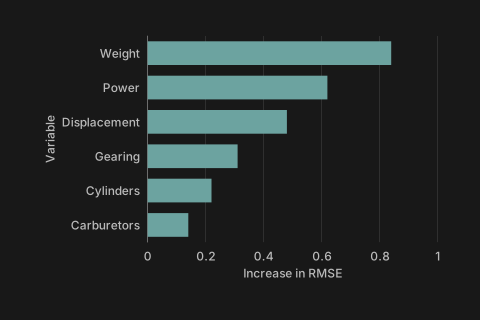
Every chart type of rtemis.draw, drawn by its high-level function. Select a chart for the page that covers it. The charts follow the light or dark theme of their page, and so do the images here.
These functions share the arguments title, theme, width, height, element_id, and filename. Categorical charts take palette, and charts that encode a quantity in color take colormap. Charts with a legend or color scale take legend_position, legend_placement, and legend_title, and charts with continuous or long category axes take zoom. Each chart type also has a configuration class, set up with its setup_*Config() function and drawn with draw(), which stores the chart as JSON; see Chart configs.
2.1 Distributions
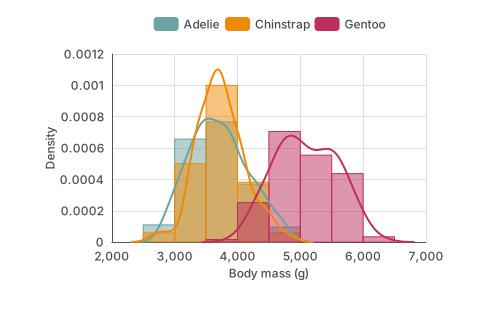
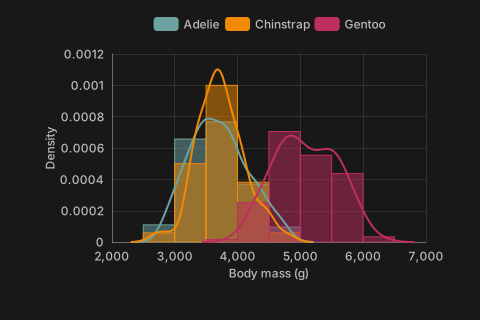
Histogramdraw_histogram()
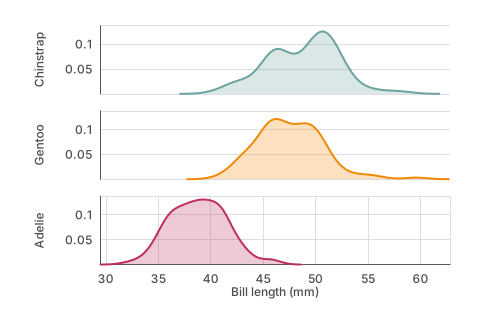
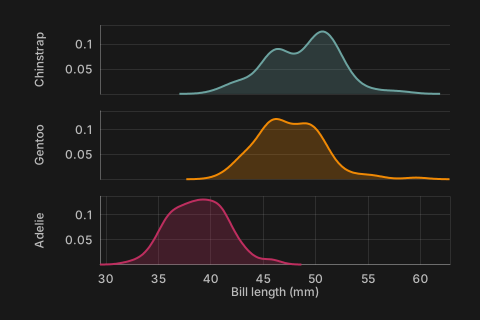
Density and ridgelinesdraw_density()
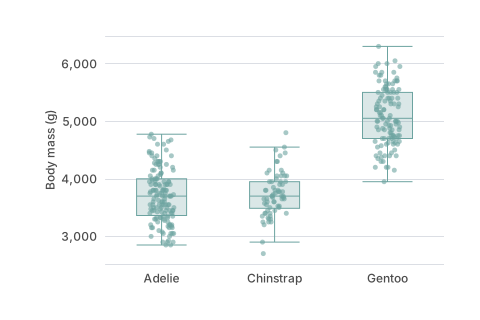
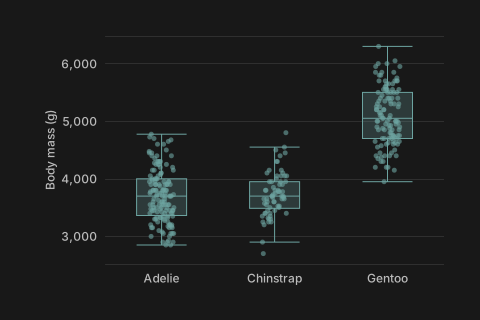
Boxplotdraw_boxplot()
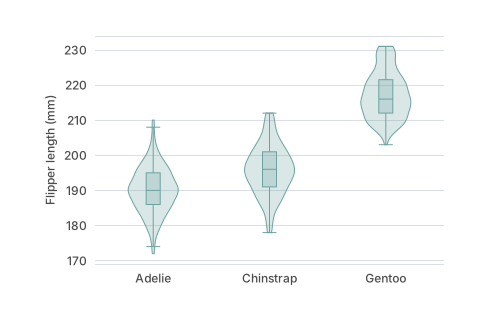
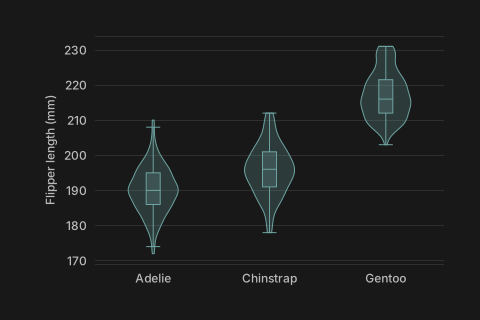
Violindraw_violin()
2.2 Relationships
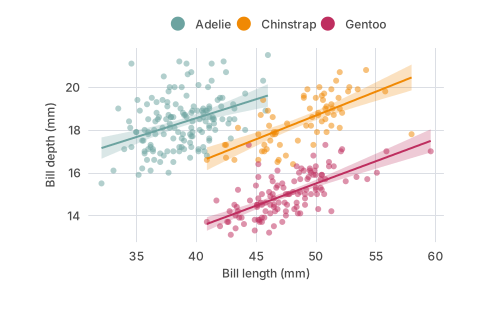
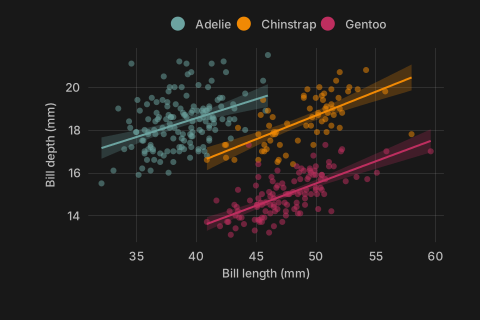
Scatter plotdraw_scatter()
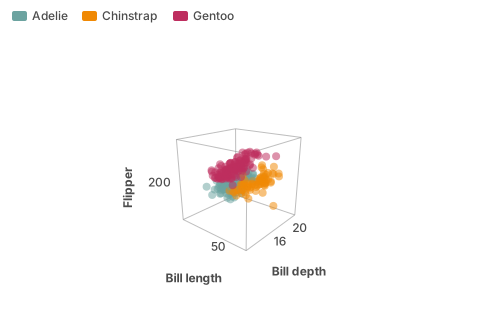
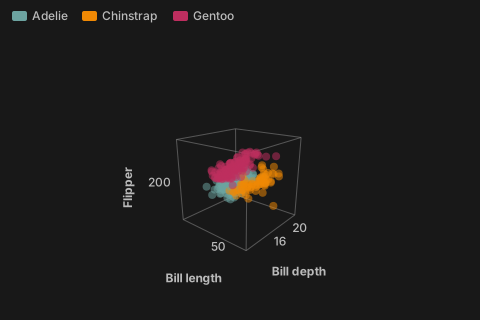
3D scatter plotdraw_scatter3d()
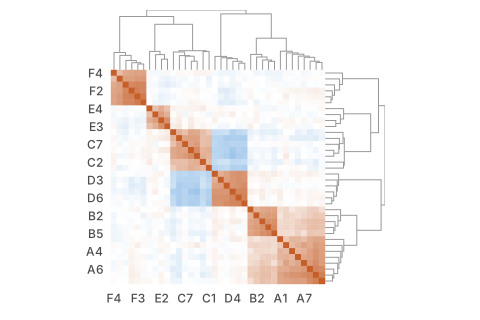
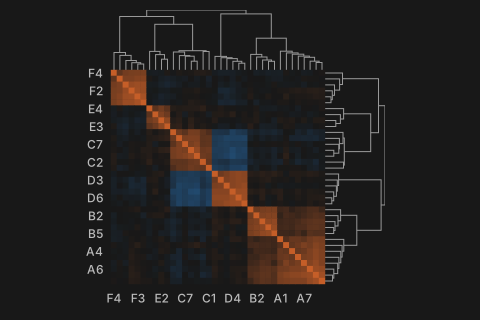
Heatmapdraw_heatmap()
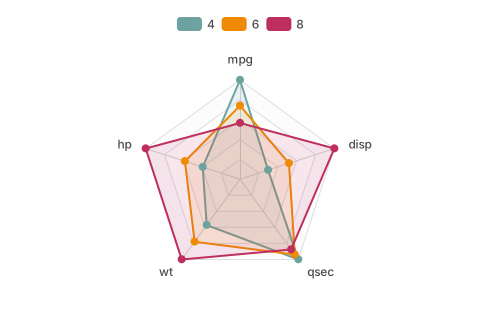
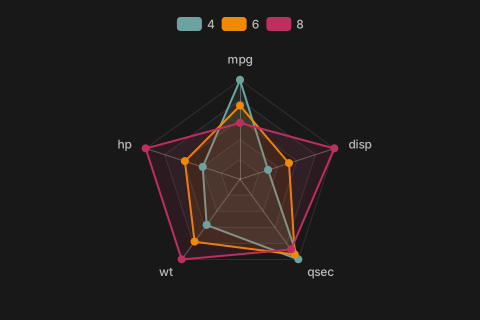
Radar chartdraw_radar()
2.3 Composition
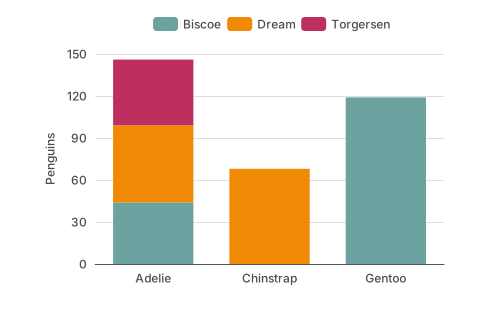
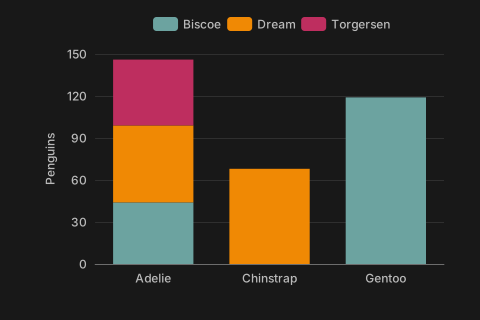
Bar chartdraw_bar()
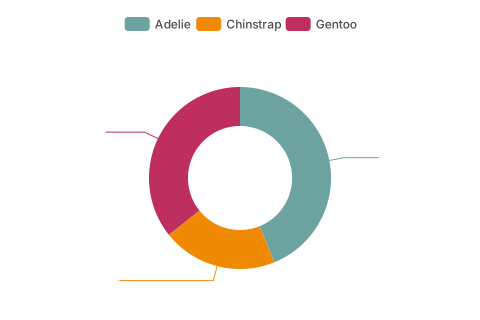
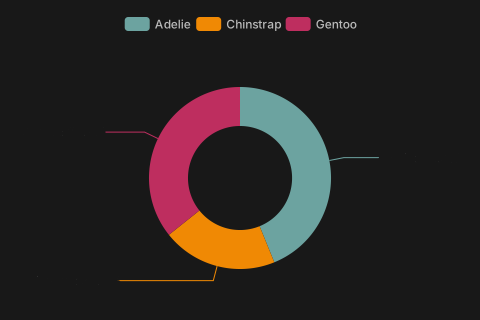
Pie and donutdraw_pie()
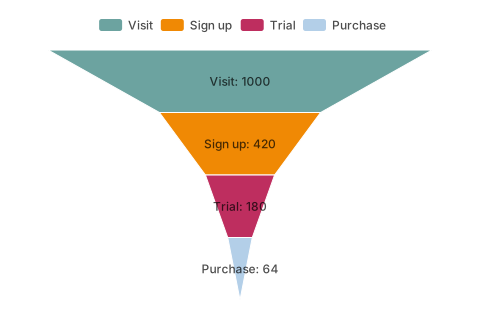
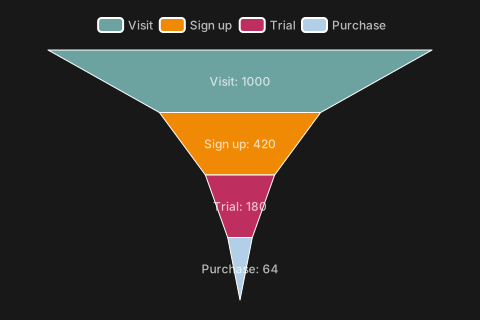
Funneldraw_funnel()
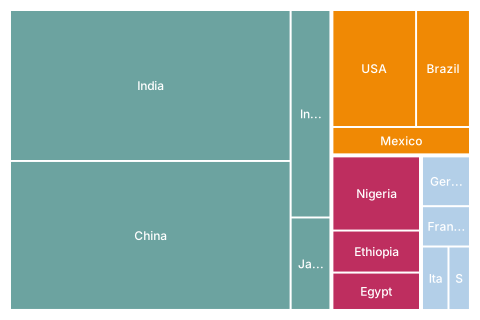
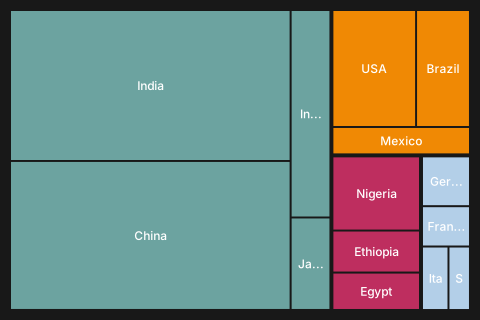
Treemapdraw_treemap()
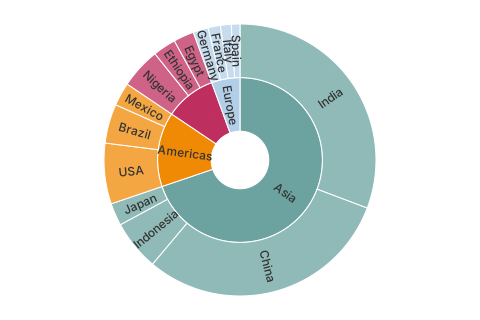
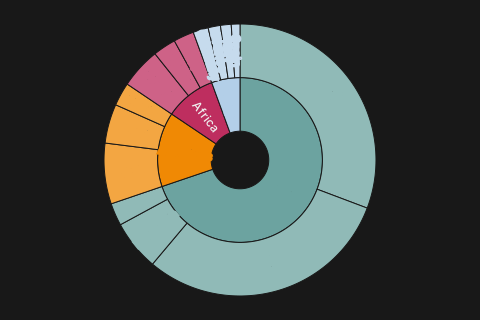
Sunburstdraw_sunburst()
2.4 Time
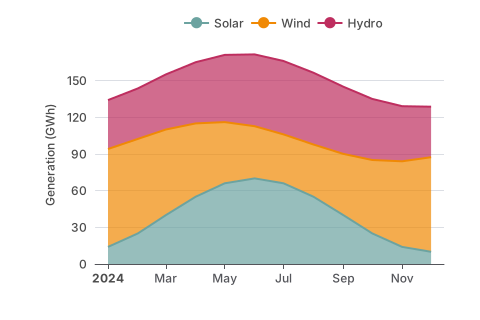
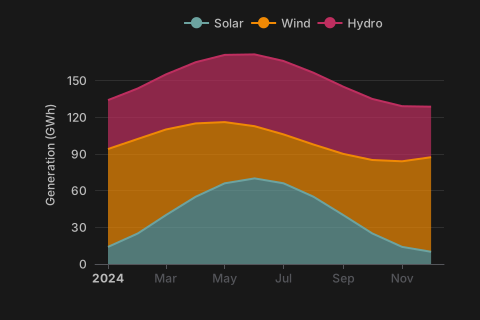
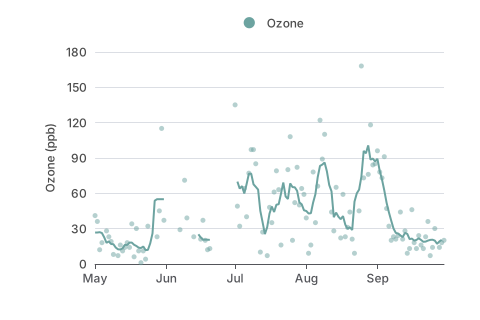
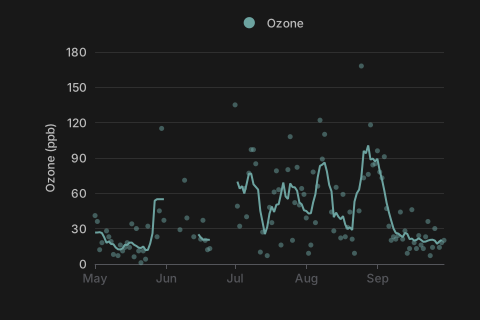
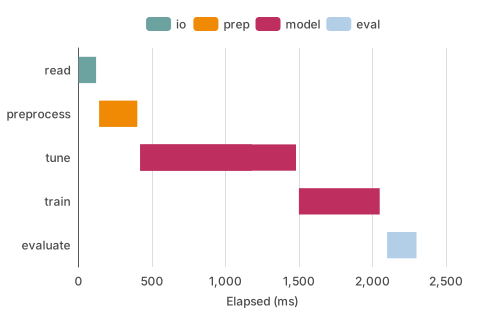
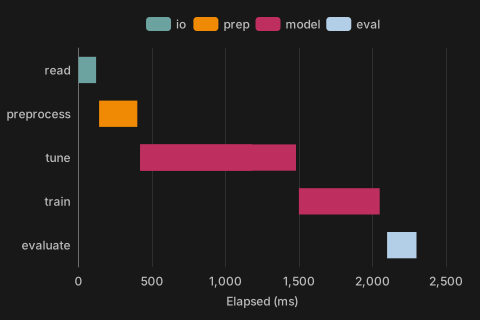
2.5 Flows and networks
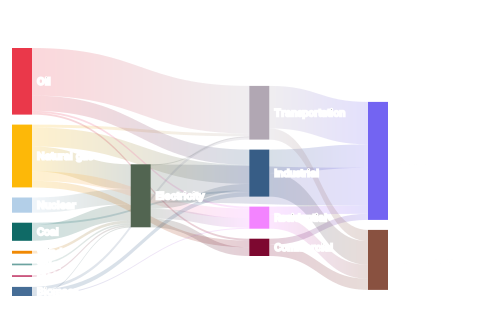
Sankey diagramdraw_sankey()
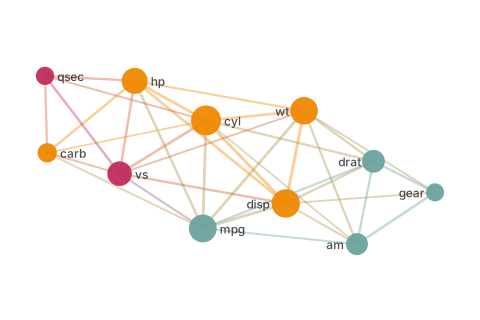
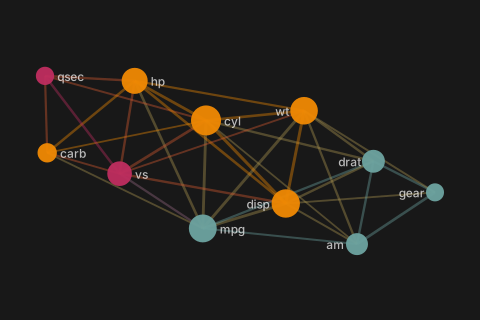
Networkdraw_network()
2.6 Maps
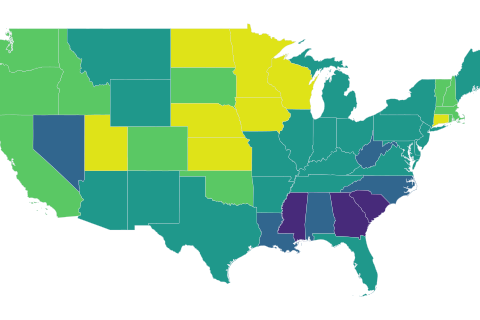
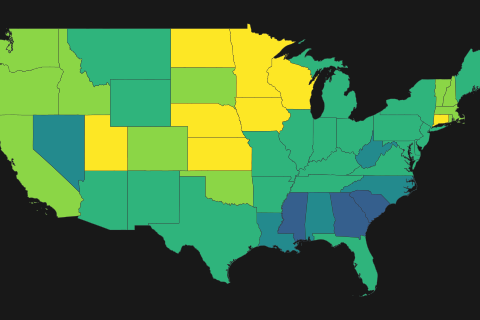
Choropleth mapdraw_choropleth()
2.7 Models and diagnostics
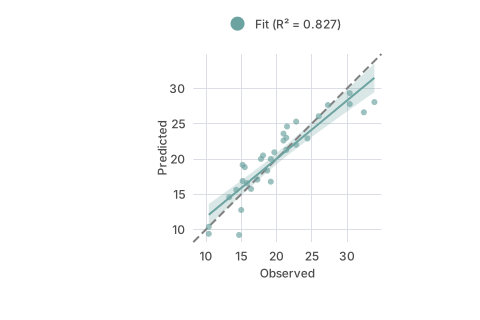
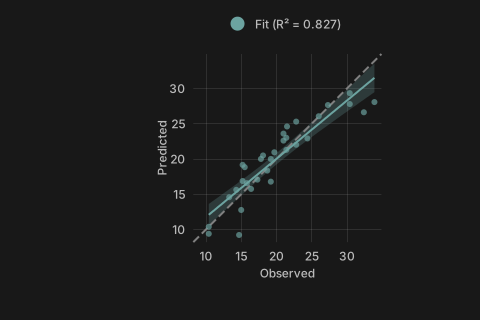
Observed vs. predicteddraw_fit()
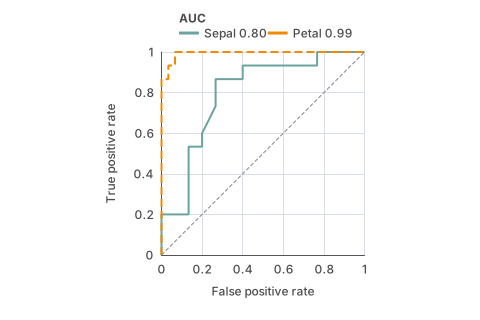
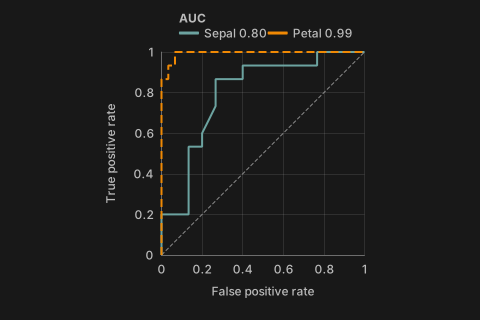
ROC curvesdraw_roc()
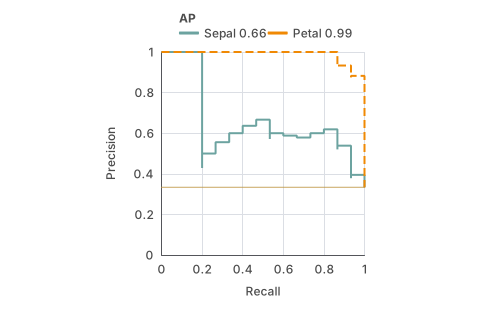
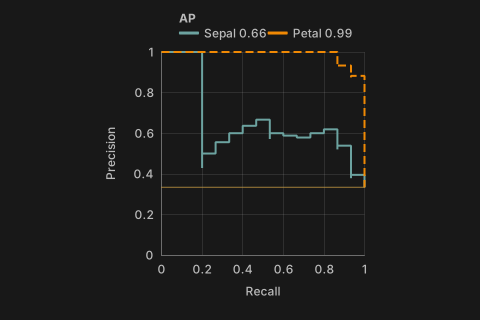
Precision-recall curvesdraw_pr()
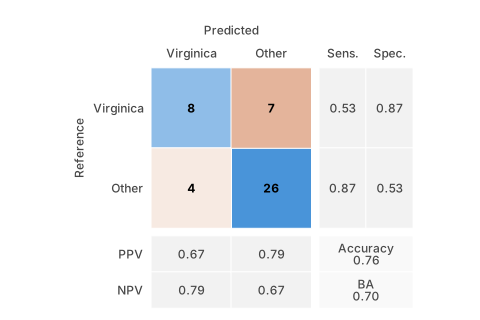
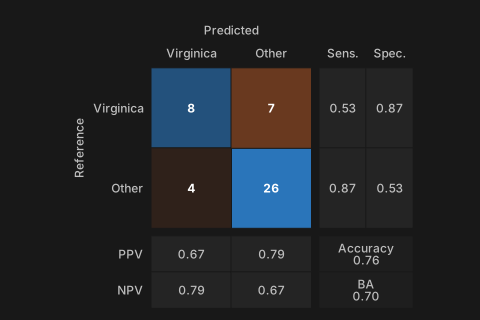
Confusion matrixdraw_confusion()
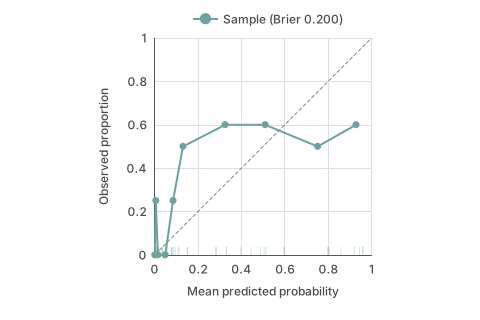
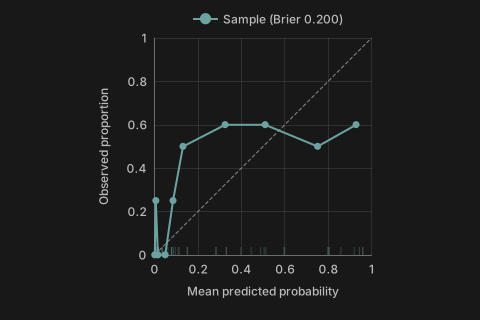
Calibrationdraw_calibration()
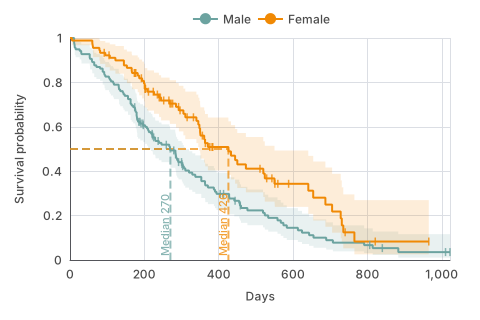
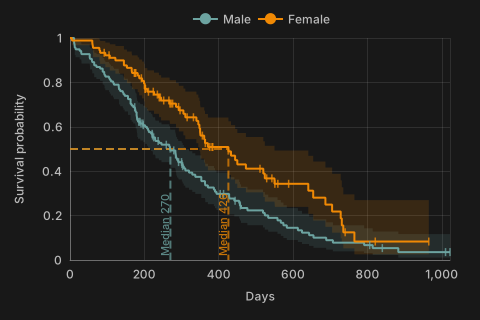
Survival curvesdraw_survfit()
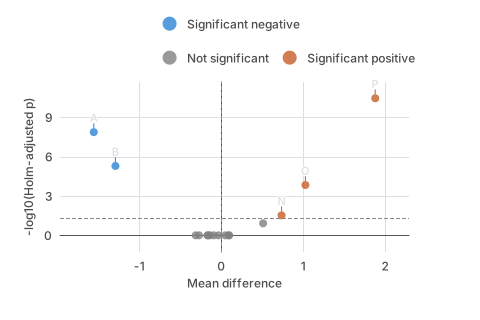
Volcano plotdraw_volcano()
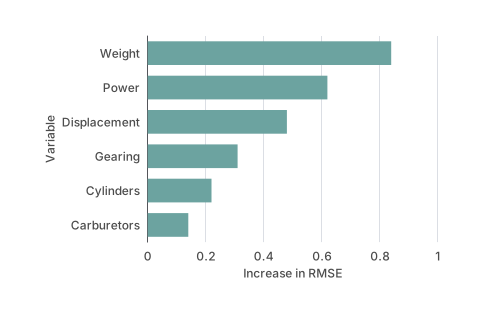
Variable importancedraw_varimp()
2.8 Diagrams and sequences
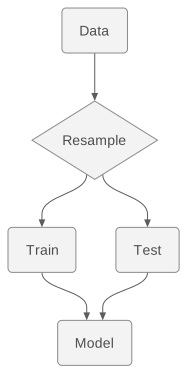
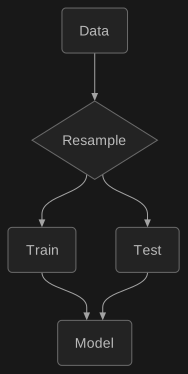
Mermaid diagramdraw_mermaid()
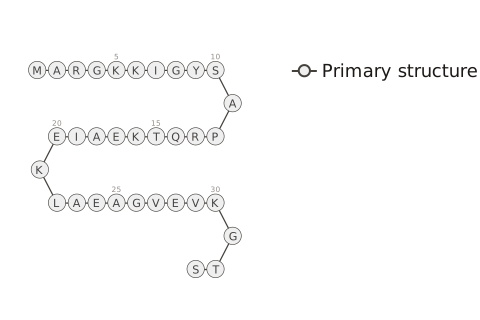
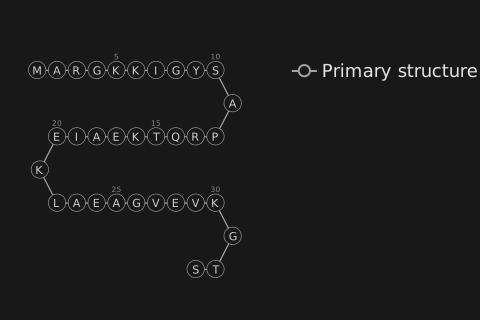
Protein sequencedraw_a3()

